Testing the usefulness of stock recommendation services
Click here to send an edit suggestion
- Pearson correlation coefficient of wallstreetzen.com 's Zen score vs. logarithm(new price/old price) was -0.2518, p-value 0.05024, based on 61 stocks.
- Pearson correlation coefficient of tipranks.com 's Smart score vs. logarithm(new price/old price) was -0.0998, p-value 0.5455, based on 39 stocks.
- Pearson correlation coefficient of zacks.com 's Zacks rank vs. logarithm(new price/old price) was 0.6741, p-value 0.0002202, based on 26 stocks. That is significant, but in the wrong direction, because a high Zacks rank is supposed to predict bad performance, not good performance. After removing 2 outliers, the correlation goes down to 0.06146, p-value 0.7806.
- Pearson correlation coefficient of gurufocus.com's Gurufocus score vs. logarithm(new price/old price) was 0.2429, p-value 0.05923, based on 61 stocks.
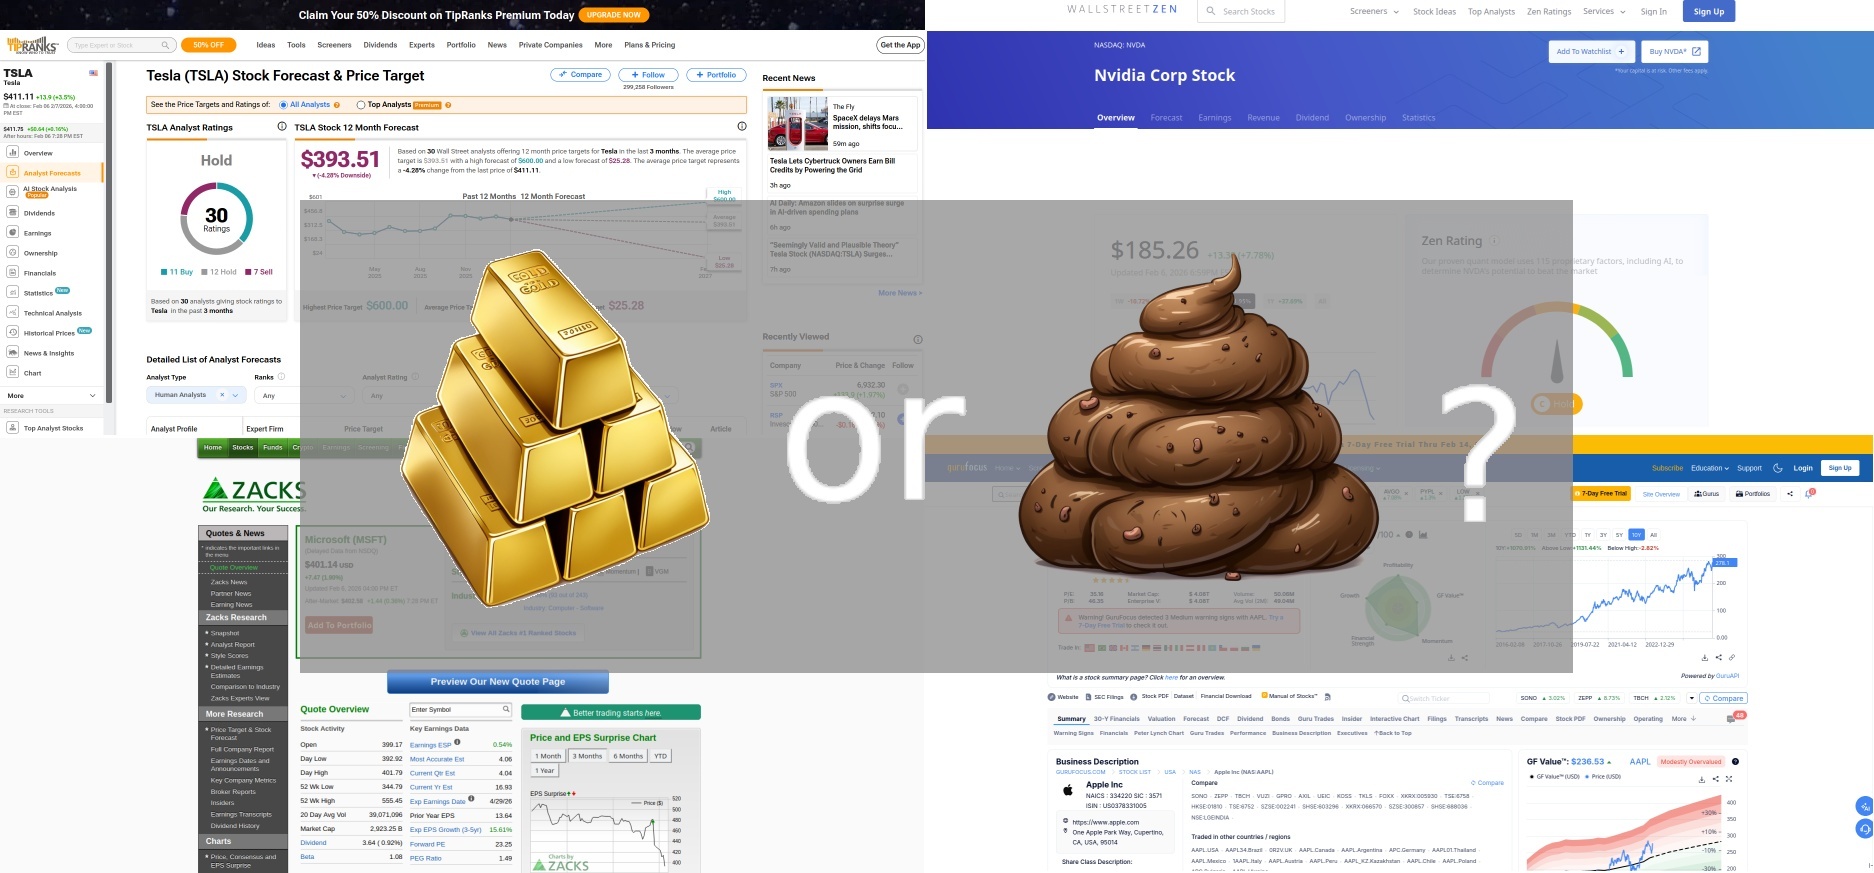
I have been annoyed by the lack of transparency and self-critical evaluation of stock recommendation service for a while and so I wanted to test their usefulness myself. I checked tipranks.com , wallstreetzen.com , zacks.com and gurufocus.com . They are paid services, but you can get information for a limited number of stocks for free (at least you could when I collected the data - it has changed now) . For each of the four services, I selected a couple of stocks I was interested in and saved the recommendation score of the selected service for the selected stock. I also saved the price (as reported by Yahoo Finance ) of the stock on the same date and then saved the price of that stock again around 10 months later to find out how the actual price development varied with the recommendation score. This all happened in 2023. The recommendation scores in question were: Zen score for wallstreetzen.com (now it's called Zen rating and is much less granular) , Smart score for tipranks.com, Zacks rank for zacks.com, Gurufocus score for gurufocus.com.
The results:
- Pearson correlation coefficient of wallstreetzen.com's Zen score vs. logarithm(new price/old price) was -0.2518, p-value 0.05024, based on 61 stocks.
- Pearson correlation coefficient of tipranks.com's Smart score vs. logarithm(new price/old price) was -0.0998, p-value 0.5455, based on 39 stocks.
- Pearson correlation coefficient of zacks.com's Zacks rank vs. logarithm(new price/old price) was 0.6741, p-value 0.0002202, based on 26 stocks. That is significant, but in the wrong direction, because a high Zacks rank is supposed to predict bad performance, not good performance. After removing 2 outliers, the correlation goes down to 0.06146, p-value 0.7806.
- Pearson correlation coefficient of gurufocus.com's Gurufocus score vs. logarithm(new price/old price) was 0.2429, p-value 0.05923, based on 61 stocks. This is the only service where investing in the 5 or 10 top-rated stocks of my sample would have produced a decent return over the observation time span, but just investing in a NASDAQ-100 ETF would have produced about the same return for the 10 stock sample, and the 5 stock sample was completely dominated by Nvidia. Without Nvidia, the remaining 4 stocks underperform the NASDAQ-100, so there is just too much luck involved for this too be a viable long-term strategy. Experts also urge you to diversify and 5 stocks isn't much diversification.
None of the correlations look particularly impressive, which of course contradicts the services' marketing. wallstreetzen.com for example brags here that their highest rated stocks (the top 5%) netted an annualized return of 32.52%. What's missing on that page of course is the crucial statement "verified by independent third party". It's possible the time horizon I used was too short or my sample size too small, but at least this experiment shows that using the recommendation score of any of these services with a "small" portfolio over about a year does not guarantee outperformance. If I can find the money and time, I might repeat this experiment with a larger sample size and longer time horizon, but I'm not holding my breath. I expect the correlation to go towards zero for larger sample sizes. Why do I think that? Simple, if these services were as great as they themselves claim, everybody would be using them and getting rich doing it. And despite having been around for decades now, I've never heard of anyone getting rich using these services. In fact, nobody has ever recommended these services to me in person. Without explicitly searching for stock recommendation services, I probably would have never heard of them. That lack of fame is not caused by me living under a rock: I've heard of people like Warren Buffett and André Kostolany long before I ever considered investing anything. The lack of fame of these 4 stock recommendation services and their customers is hard to square with their supposed substantial outperformance of the S&P 500 .
You can identify underperformers with the recommendation services, but these are usually tiny companies that are not part of any large index, so by just investing in a boring old passive index ETF, you get the automatic benefit of avoiding these underperformers. Even if they were part of the index, they would have such a small weighting that they hardly influence the result. And shorting the underperformers is also not viable, because underperformance does not mean guaranteed decline, it just means they don't keep up with the benchmark and also only on average. Trying a complicated strategy with multiple options to bet specifically on the underperformance might work before fees and other costs, but the shortfall is too small and thus I doubt the return outpaces the costs.
I didn't evaluate Motley Fool directly, but I found "Evaluating the performance of the motley fool's stock advisor" by Filbeck, Lyon and Zhao and that publication did all my work for me and the result is very unflattering for Motley Fool.
If you want to see some scatter plots (courtesy of the same calculator I used to calculate the correlations), here you go:
wallstreetzen.com

tipranks.com

zacks.com

gurufocus.com

The correlations and p-values above have been calculated with this online calculator . The usual disclaimers apply: This is not investment advice. I deny all responsibility if you make any decisions based on this information.
Click here to send an edit suggestion
Written by the author; Date 07.02.2026; Updated 08.02.2026; © 2026 spinningsphinx.com
Written by the author; Date 07.02.2026; Updated 08.02.2026; © 2026 spinningsphinx.com
Written by the author; Date 07.02.2026; Updated 08.02.2026; © 2026 spinningsphinx.com
Written by the author; Date 07.02.2026; Updated 08.02.2026; © 2026 spinningsphinx.com
- Mocking
- Sarcasm, e.g. "Homeopathy fans are a really well-educated bunch"
- Statement not to be taken literally, e.g. "There is a trillion reasons not to go there"
- Non-serious/joking statement, e.g. "I'm a meat popsicle"
- Personal opinion, e.g. "I think Alex Jones is an asshole"
- Personal taste, e.g. "I like Star Trek"
- If I remember correctly
- Hypothesis/hypothetical speech, e.g. "Assuming homo oeconomicus, advertisement doesn't work"
- Unsure, e.g. "The universe might be infinite"
- 2 or more synonyms (i.e. not alternatives), e.g. "aubergine or eggplant"
- 2 or more alternatives (i.e. not synonyms), e.g. "left or right"
- A proper name, e.g. "Rome"